- Real-time fire detection · FWI modeling · Smoke forecasts · Perimeter tracking
Wildfire Data
Advanced wildfire risk assessment, real-time fire detection, and predictive
analytics to protect lives, property, and ecosystems.
- MODIS + VIIRS Detection
- FWI + Fosberg Index
- Smoke Dispersion
- 10m Wind Modeling
- Air Quality Index

<10 min
Fire Detection Latency

375m
VIIRS Hotspot Resolution

Global
Coverage (All Continents)

72-hr
Spread Forecast Range

Real-time
AQI & Smoke Forecasts
- Live Wildfire Map
Active Fire Monitoring
Every active wildfire and hotspot globally — detected from MODIS and VIIRS
satellite sensors, updated in near real-time, with fire perimeter and risk zone
overlays.
- Live Hotspots
- 1,247 active
- Updated 6 min ago
Fire Risk Level
- Extreme
- Very High
- High
- Moderate
- Low
Active Incidents
- Live
Caldor Ridge Fire
CA
Extreme
Miller Creek Complex
OR
High
Pinon Mesa Fire
CO
Moderate
Cascade Monitoring
WA
Moderate
Fire Danger Outlook
Worldwide fire danger outlooks offer valuable information for outdoor conditions.Our Fire Danger
Our Fire Danger Outlooks are based on an analysis of factors including:
- Humidity
- Winds
- Map dataHeat
- Vegetation moisture content
- Lightning probability
- Fire danger outlooks for over 80,000 worldwide forecast locations – detailed and extended
- Updated every 6 hours
Active Fire Data
- Active Fires including fire start location (Worldwide) as determined by VIIRS/NASA – updated every 15 minutes
- Active Fire Perimeters (US Only) as provided by the National Interagency Fire Center – updated twice daily
- Current wildfire shapefiles from MODIS satellite (US Only) – updated once daily
- 💨 Smoke & Air Quality
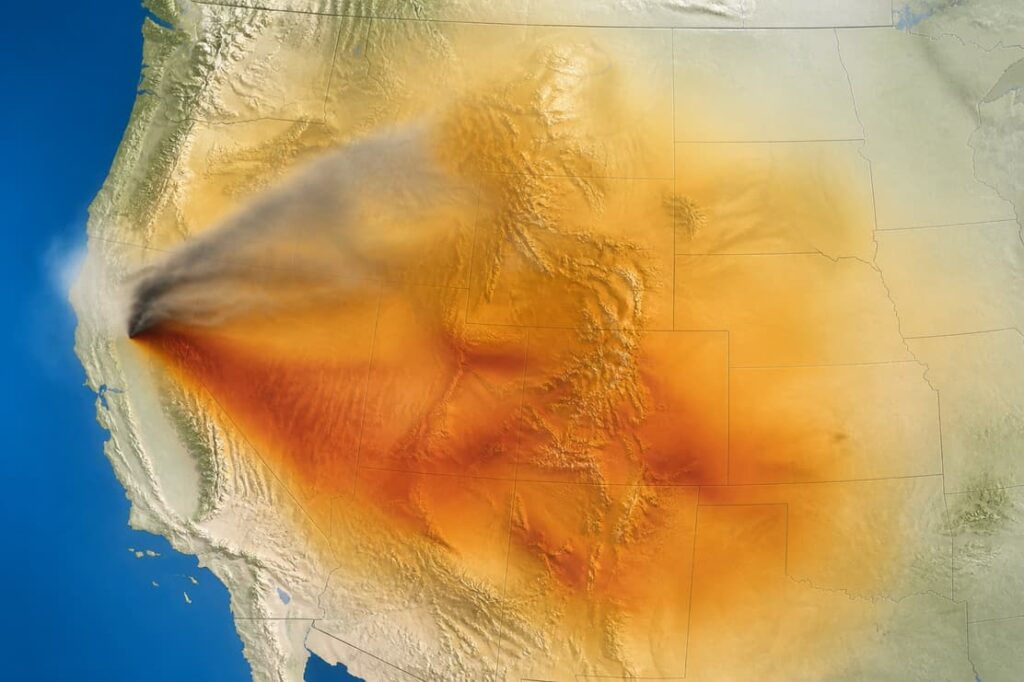
Smoke Dispersion & AQI Forecasts
Real-time and forecast PM2.5 concentrations and AQI categories at
3km resolution — so communities, employers, and event organizers can
make timely decisions about outdoor exposure.
Our smoke model ingests satellite-detected fire radiative power, atmospheric
wind data, and boundary layer stability to produce 48-hour plume forecasts
updated every hour.
AQI SCALE
- Good
0–50
- Moderate
51–100
- Unhealthy (Sensitive)
101–150
- Unhealthy
151–200
- Very Unhealthy
201–300
- Hazardous
301+

Satellite PM2.5 Validation
GOES-16 AOD data continuously calibrates our PM2.5 model, reducing errors by 40% vs. chemistry-only approaches.

Community-Level Resolution
3km grid allows zip-code-level AQI forecasts — actionable for schools, stadiums, and outdoor workplaces.

Push Alert Integration
Trigger automated alerts to employee apps, community systems, or public safety platforms when AQI crosses thresholds.